Dec 14 / Kumar Satyam

Understanding Time Series Forecasting in Machine Learning

Time Series Forecasting

Time Series Forecasting img
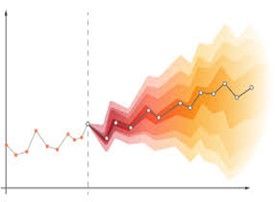
Time series forecasting is a methodology for estimating unknown future values of a variable based on its previous observations, with time being a significant factor. In contrast with standard predictive modeling and its related models, traditional ones concentrate on how the data is arranged over time in a sequence. In this regard, they are beneficial in giving an insight into the likely direction of some trends or sequences of events. The focus is to identify patterns like upward or downward trends over time, repeating cycles over time (seasonality), and correlations (the effects of past values on the current and future time intervals). Many sectors require forecasting. Time series models are applied to predict stock prices, interest rates, and foreign exchange rates in the financial industry. In the case of economics, these models are used to make predictions about factors such as GDP, unemployment, or inflation. Within the supply chain management domain, forecasts support resource planning, scheduling of production, and inventory control to ensure that demand is satisfied. Weather forecasting also utilizes time series forecasting methods; estimations of temperature, precipitation, or even storms seen at a particular geographical region are based on time series of the weather data for that region. Optimum forecasting can enable business organizations and governments to make sound decisions, minimize risks, and seize foresighted opportunities. Because of these factors, time series forecasting will be helpful in the success of many endeavors.

Key Concepts in Time Series Forecasting

Trend

The term trend means the long-term movement of a time series data set. It indicates whether the data points tend to increase, decrease, or remain constant. Trends can be straight or bent and take place for short( in months) or long (in decades) periods. Seeing a pattern helps understand why one can appreciate the data, which is essential in making assumptions. For instance, if a company records a consistent increase in its sales for years, it could do better by forecasting the required adjustment in utilizing its stock and marketing actions. Trends make it possible for one to understand future emerging circumstances.

Seasonality

Seasonality is a characteristic of a series in which certain intervals are marked by upturns and downturns that recur with a high degree of regularity. Depending on the data type, these patterns may be noticed daily, weekly, monthly, or yearly. For instance, retail sales tend to increase during the festive seasons or months, such as December, when people purchase gifts for their loved ones. Similarly, electricity usage tends to rise during the hot summer months owing to the use of air conditioning and colder winter months because heating is being used. Recognizing these seasonal trends is critical in ensuring reliable forecasts. However, if understood by the firms, such trends can make changes and inform forecasts and decisions based on the behavioral changes they expect.

Autocorrelation 

Autocorrelation is one of the descriptive statistics in time series analysis that measures how a time series at a particular time point is related to its different time lags. However, it measures how current values in the series are related to the values in the series at a time lag. For example, a high autocorrelation time lag indicates that the earlier values significantly affect the values at present. This is important for discerning the patterns present and ascertaining suitable forecasting techniques. In cases where the time series autocorrelates to a large degree, the prior readings would aid significantly in estimating future readings.

Stationarity

This research posture gives particular importance to time series data, as its primary statistical characteristics, such as mean, variance, and autocorrelation, which measure how the current value is related to past values, do not change over time. Stationary data is more accessible to analyze and predict as it does not show any underlying trend and seasonal variations. Several forecasting techniques, especially ARIMA, impose that the data must be stationary to yield plausible results. In instances where the time series is not stationary, measures are put in place to ensure that the series is made stationary. One is differencing, which means subtracting the previous and current observations. Detrending is another technique that focuses on eliminating trends from information. Identifying and addressing non-stationary data tendencies is essential when developing effective forecasting models.

Popular Models for Time Series Forecasting

Popular Models for Time Series Forecasting img

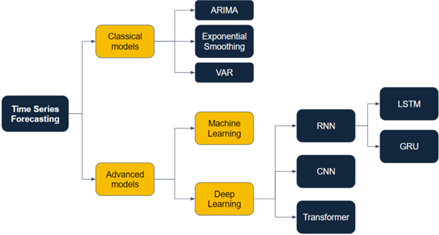
ARIMA (AutoRegressive Integrated Moving Average)

ARIMA is a popular statistical model used for forecasting time series data. It combines three main components. The first is autoregressive, which looks at how current observations relate to previous ones. In other words, it uses past values to help predict future values. The integrated component focuses on making the data stationary by differencing it. Differencing means subtracting the previous value from the current value to remove trends or seasonal patterns, which helps improve the accuracy of predictions. The moving Average examines the relationship between an observation and past prediction errors (or residuals). It helps adjust future forecasts based on past mistakes. ARIMA is particularly useful for analyzing univariate time series data that shows linear trends. An everyday use case for ARIMA is predicting stock prices or sales figures, where understanding past performance can guide future expectations.

Prophet Model 

Prophet is a forecasting tool that Facebook has evolved to make it reasonably easy to adjust for seasonalities, holidays, and trends. It also incorporates very well in cases where there are incomplete observations and can model sigmoidal or other non-linear increasing functions. Because of this versatility, Prophet is very valuable for enterprise-related cases, especially where time series analysis has to account for seasonal variations. For example, it can be helpful to predict website visitors or the sale of seasonal products. The Prophet's requirement, or instead, the absence of requirements, is the best part of the tool. As a result, anyone, whether a statistician or not, can make any forecast without any fuss. This means that predictions that can be acted upon and based on facts do not require the expertise of data scientists to obtain them.

LSTMs (Long Short-Term Memory Networks)

LSTMs (Long-Short-Term Memory Networks) represent a class of recurrent neural networks (RNNs) geared towards discovering relationships in time series data over long time scales. In contrast to the usual models, LSTMs learn and retain sophisticated patterns for an extended period and hence are fitted for non-linear time series data with elaborate trends. LSTMs are especially helpful for predicting power usage or economic indicators, where many factors can influence the connections between data points over time. Because LSTMs can remember important information from the past, they often perform better than simpler models in these situations. This capability allows them to provide more accurate forecasts for time series data that have intricate patterns.

Time Series Forecasting Applications in Finance

In finance, doing time series forecasting is critical in cases such as stock price prediction, prediction of interest rates, and market trend forecasting, among others. For instance, analysts tend to review historical stock prices and suppose the future price using ARIMA, LSTMs, or any other stock price forecasting models. These techniques help guide investors in putting their money into a particular stock or holding their investment. Another vital prediction that financial institutions such as banks tend to focus on is forecasting interest rates, which helps them control the use of the banks’ resources on loans and investments to remain in business. Businesses, especially financial institutions, can forecast the change in interest rates, helping the institution make optimal lending and investment decisions. Furthermore, effective marketing research and analysis forecasting of economic trends also enhances business planning. Due to changing economic conditions, people can modify their methods to continue doing well in the market. To sum up, forecasting trends is one of the most valuable strategies in finance, and it aids in reducing risks when making any investment decisions.

Time Series Forecasting in Economics and Operations

Economics: Thinking beyond the current period, economists employ time series forecasting to ascertain critical economic indicators, such as GDP growth, inflation rates, and employment levels. They look at past and present information about the financial trends and give estimations on the future trends in that data and how fallouts of regulatory policies or global occurrences will impact the economy. For instance, estimating a particular sector's GDP contribution becomes essential for governments and businesses as these institutions will need to prepare their budgets and make investments, which is necessary to ensure the availability of economic resources shortly. They can use available resources more efficiently if they have forecasted the economy's performance. In the same way, inflation rate predictions are important for politicians as they help avoid any unintentional surge in prices that would be unfavorable. This is imperative in ensuring that customers’ trust is not lost and that the economy remains robust. If people are comfortable with prices not changing significantly, they will likely expend money, and thus, economic activities will flourish. All in all, purchasing power forecasting using time series is one technique that enables economists to arrive at sound conclusions regarding the country's financial expectations.
Time Series Forecasting in Economics and Operations
Operations: Operations and supply chain management practices require forecasting the needed amount of inventory and efficient planning of production schedules. In most cases, companies analyze historical sales information to develop dopamine likely to be experienced in the future. This assists in regulating the available stocks in the market and not having excess or deficit supply. For instance, a retail outlet may be able to project the sales of particular products during peak periods such as the Christmas season. In this way, they will make an effort to ensure that excess quantities of these items are made available not to disappoint customers when there is an increase in demand. It also plays a role in working out the logistics of a supply chain; that is, firms can also arrange for the production and movement of goods. Understanding what to produce and when to provide it can lower costs for the business while ensuring customers do not go without the products they want—lastly, efficient demand forecasting results in better operations and improved service in general.
Created with