- Removing Rows or Columns: If the missing information is minimal or exists predominantly in the specific columns and rows, you can prune them off the structure. However, caution is advised, as this may result in the risk of omitting significant data.
- Mean/Median/Mode Imputation: This technique pertains to the process of supplementing any unaccounted-for values in a given set of data with either the average (mean), the middle figure (median), or the frequently seen number (mode) of the dataset in question. For example, missing numbers in a column can be averaged and filled with the mean of the column. This is a straightforward and efficient method when the missing information is scattered and is not substantial.
- Imputation Using Algorithms: More advanced techniques use K-Nearest Neighbors (KNN) or regression models to predict and fill in missing values based on other available data. These methods consider patterns in the dataset to make more accurate guesses about the missing values.
- Forward/Backward Filling: In time series data, where information is recorded over time, missing values can be filled using the last known value (forward fill) or the next known value (backward fill), assuming the data follows a particular trend.
Outliers are data points that remarkably deviate from most data points in a dataset. They can substantially impact machine learning models and susceptible algorithms such as linear regression. Such algorithms heavily depend on a specific distribution of the data, and since outliers affect this distribution, predictions based on them, and the model in general one that is overfitting, are inaccurate. Taking linear regression, for instance, during regression analysis, an outlier can disproportionately shift the regression line towards itself, introducing a bias in the relationship between the two variables.
Methods for Detecting Outliers: The Z-score procedure refers to the technique indicating a deviation of a data element from its mean in standard deviations. Any dataset element with a Z-score more significant than three or less than –3 is frequently viewed as an outlier since it is distant from the rest of the data points. The Interquartile Range (IQR) is another method in which we can define and defend our concept of Outliers and their detection.
Approaches for Handling Outliers: In the removal method, outliers can be deleted from the dataset if they are mistakes or don't represent the typical data. This method is straightforward but can result in losing important information if not done carefully. In the Transformation approach, outliers can be adjusted using log transformation or scaling methods to lessen their impact on the model. This is helpful when the outliers are real but must be managed to avoid skewing the results. The (Capping or Flooring) method sets a maximum (cap) or minimum (floor) limit for data points, which helps control the influence of extreme values by bringing them within a reasonable range.
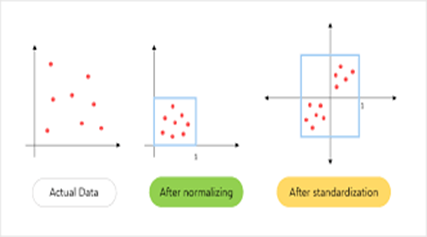
Normalization and standardization of data are the critical processes involved in data preparation for machine learning, as they improve the models' performance by ensuring that the features are on the same scale. Specific algorithms such as K-nearest neighbors (KNN) and neural networks depend, for instance, on how the data is scaled. If features have very different ranges, those with more extensive ranges can overly influence the model, leading to inaccurate predictions. Normalization changes the data to fall within a specific range, usually between 0 and 1. This is useful when your data has features with different units or ranges. For example, KNN measures distances between data points, so if one feature has a much more extensive range, it could dominate the distance calculation, leading to poor results. Normalization ensures that all features are treated equally. Standardization adjusts the data with a mean of zero and a standard deviation of one. This is especially important for neural networks, where unscaled data can cause the model to train slowly or get stuck in suboptimal solutions.
An essential aspect of modeling, known as feature engineering, is the process of data metamorphosis into usable features, which improves a model's performance. Effectively transforming data allows one to hide some patterns inherent in the data, allowing the models to learn and predict accurately. Feature Engineering is the process of making new features or improving the existing ones to strengthen one's model. For instance, transforming a feature into a more informative format can provide more precise insights.
Techniques for Data Transformation:
- Log Transformation: This technique helps with data that is skewed or has extreme values. By applying a logarithmic function, you can reduce the influence of huge numbers and make the data more evenly spread. For example, if you have financial data with tremendous value, log transformation can help smooth out these values, making the data more useful for analysis.
- Polynomial Features: This method creates new features by raising existing ones to power (like squaring or cubing) or combining features. For example, if you have a feature like "size," adding features for "size squared" or "size cubed" can help capture more complex patterns in the data that superficial linear relationships might miss.
- Binning: This process turns continuous data into categories or ranges. For example, instead of using exact ages, you can group ages into ranges like 0-10 and 11-20. This simplification can make it easier to find patterns and can be helpful for certain types of models.
Proper preprocessing makes models more accurate and reliable by ensuring the data is clean, consistent, and well-organized. For example, filling in missing data prevents losing important information, which helps the model make better predictions. Scaling features so they’re on the same level ensures that all features are treated relatively in algorithms like KNN. Turning categories, like "neighborhood," into numbers allows models like linear regression to understand them. Treating outliers, such as using log transformation, stops them from distorting results. These steps prepare the data better for the model, leading to improved performance.
Pandas: Pandas is a widely used Python tool that quickly enables data utilization. It is frequently used to facilitate incomplete datasets, encode categorical values, and feature engineering. The most significant aspect of Pandas is the data frame, which helps one efficiently determine the cleaning and manipulation process. Pandas can impute data where it is missing, engineer new data from available data, and encode variables for machine learning algorithm usage. This makes Pandas a vital tool for getting data ready for analysis.
Scikit-learn: Scikit-learn is a vital Python library that offers many tools for preparing and building machine learning models. It includes utilities like StandardScaler, which helps scale features, so they all have the same range—essential for algorithms like KNN. OneHotEncoder converts categories into numbers that models can use, and train_test_split helps divide data into training and testing sets. These tools simplify the process of building and testing machine learning models, making Scikit-learn an essential resource for data science.
TensorFlow: TensorFlow's Data Processing Utilities include the tf.data API, which is built to load and transform data efficiently. This API handles tasks like grouping data into batches, shuffling it, and applying custom transformations. These features are handy for managing large datasets in deep learning projects. By using these tools, TensorFlow makes it easier to prepare data for training complex models, saving time and ensuring the process runs smoothly.